K-Nearest Neighbors (KNN) is a simple, non-parametric algorithm used for both classification and regression tasks. It makes predictions for a new data point based on the K closest data points (neighbors).
Not to be confused with K-means clustering. KNN is a supervised algorithm for classification/regression finding nearest neighbors, K-means is an unsupervised algorithm for clustering finding cluster centroids.
How It Works
Choose the number K of neighbors
Calculate the distance between the query instance and all training samples
Sort the distances and determine the K nearest neighbors
For classification:
Aggregate the class labels of K neighbors
Return the majority vote as the prediction y^=mode(yi),i∈K nearest neighbors
For regression:
Aggregate the values of K neighbors
Return the mean value as the prediction y^=K1∑i∈K nearest neighborsyi
As KNN algorithm does not build a model during the training phase, it is called a lazy learner. The algorithm memories the entire training dataset and performs an action on the dataset at the time of prediction.
Distance Metrics
Euclidean Distance: d(x,y)=∑i=1n(xi−yi)2
Manhattan Distance: d(x,y)=∑i=1n∣xi−yi∣
Minkowski Distance: d(x,y)=(∑i=1n∣xi−yi∣p)p1
Computational Approaches
Brute Force: Calculates distances to all points. Simple but inefficient for large datasets.
K-D Tree: Space-partitioning data structure for organizing points in K-dimensional space: “The basic idea is that if point 𝐴 is very distant from point 𝐵, and point 𝐵 is very close to point 𝐶, then we know that points 𝐴 and 𝐶 are very distant, without having to explicitly calculate their distance”. Efficient for low-dimensional data.
Ball Tree: Hierarchical data structure using hyper-spheres. Efficient for high-dimensional data.
Advantages
Simple implement
No assumptions about data distribution (non-parametric)
Can capture complex decision boundaries
Disadvantages
Computationally expensive for large datasets
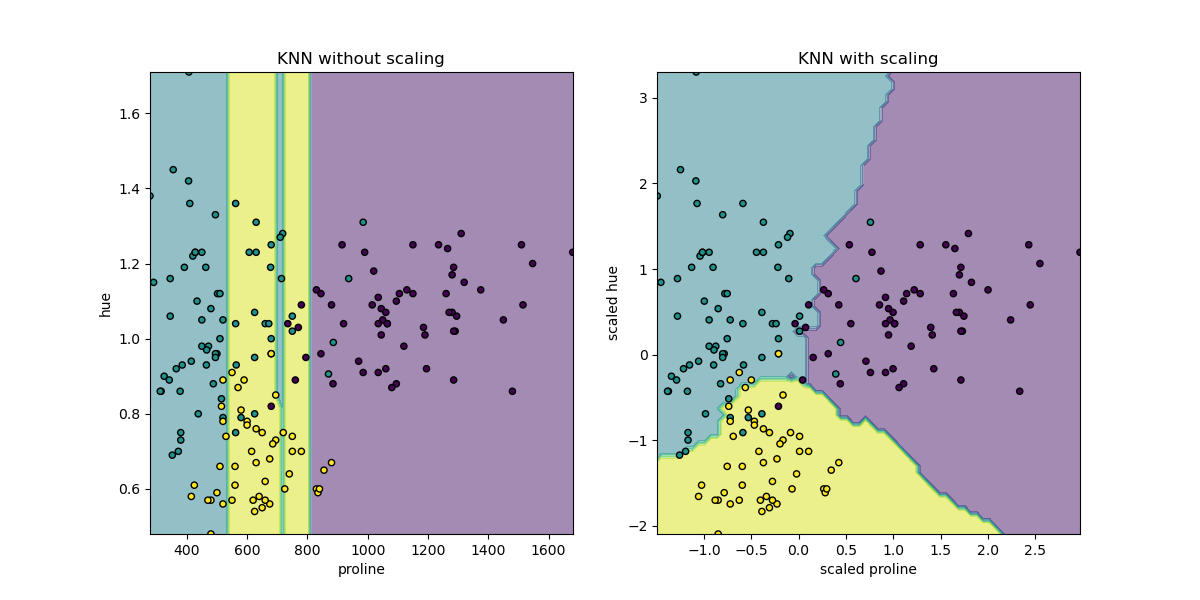
Sensitive to the scale of features
Curse of dimensionality: performance degrades with high-dimensional data
Choosing K
Odd K for binary classification to avoid ties
Square root of N (where N is the number of samples) as a rule of thumb
Use cross-validation to find optimal K
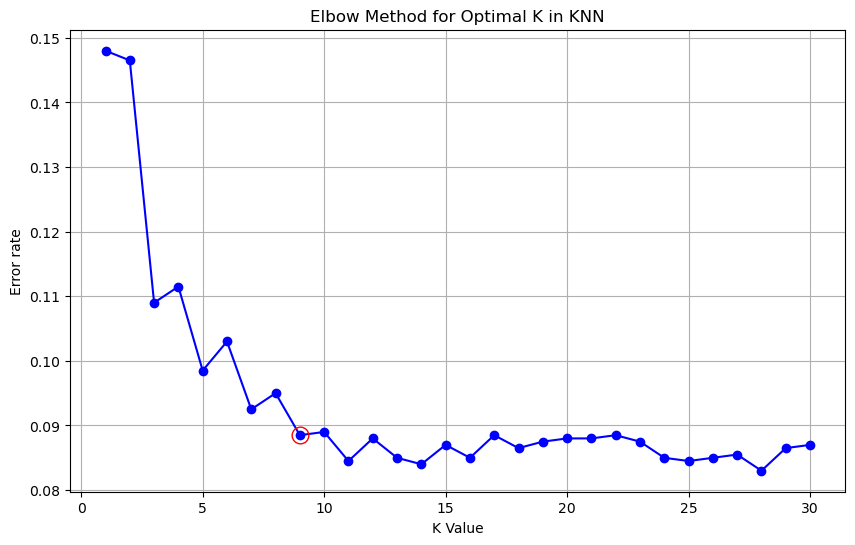
Elbow Method: calculate error for different values of K, make a plot, look for an “elbow” on it - where the error begins to level off.
Code example
import numpy as npfrom collections import Counterclass KNN: def __init__(self, k=3): self.k = k def fit(self, X, y): self.X_train = X self.y_train = y def euclidean_distance(self, x1, x2): return np.sqrt(np.sum((x1 - x2) ** 2)) def predict(self, X): predictions = [self._predict(x) for x in X] return np.array(predictions) def _predict(self, x): distances = [self.euclidean_distance(x, x_train) for x_train in self.X_train] k_indices = np.argsort(distances)[:self.k] k_nearest_labels = [self.y_train[i] for i in k_indices] most_common = Counter(k_nearest_labels).most_common(1) return most_common[0][0]